ふたたび Gitのdiffを振り返る - @ledsun blog で日単位で集計しました。
週、月、年単位の集計結果も見ていきましょう。
週
gnuplot> set xdata time
gnuplot> set timefmt "%Y-%m-%d_%H:%M:%S"
gnuplot> plot 'all_log_week.dat' using 1:2 w i title 'insertions' lw 2, 'all_log_week.dat' using 1:3 w i title 'deletions' lw 2
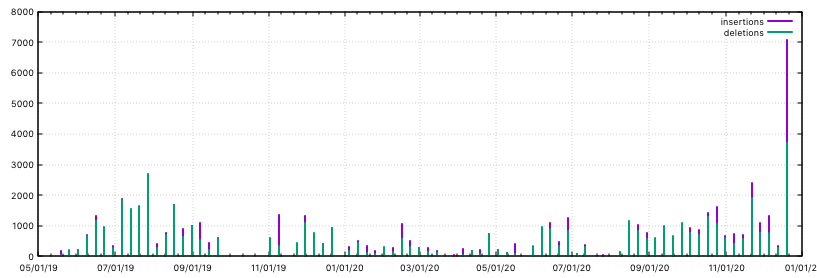
グラフが見やすくてよいです。
月
gnuplot> plot 'all_log_month.dat' using 1:2 w i title 'insertions' lw 2, 'all_log_month.dat' using 1:3 w p title 'deletions'
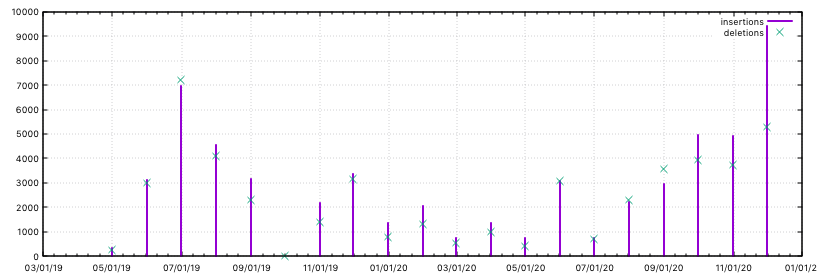
これも全体的な傾向をつかめているように思います。
今後の追跡調査は、週または月で集計するのが良さそうです。
年
gnuplot> plot 'all_log_year.dat' using 1:2 w l title 'insertions', 'all_log_year.dat' using 1:3 w l title 'deletions'

2019年が5月開始なので、8ヶ月分のデータしかありません。 期間が1.5倍なので、増加量としては妥当な感じです。
insertions/deletionsの比率が1.1から1.3に増えているのが興味深いです。 機能追加が多かったのでしょうか?